Client Name

Duration
March 2024 - March 2025
Context
Freelance work
Role
Collaborators
Three engineers and product owner
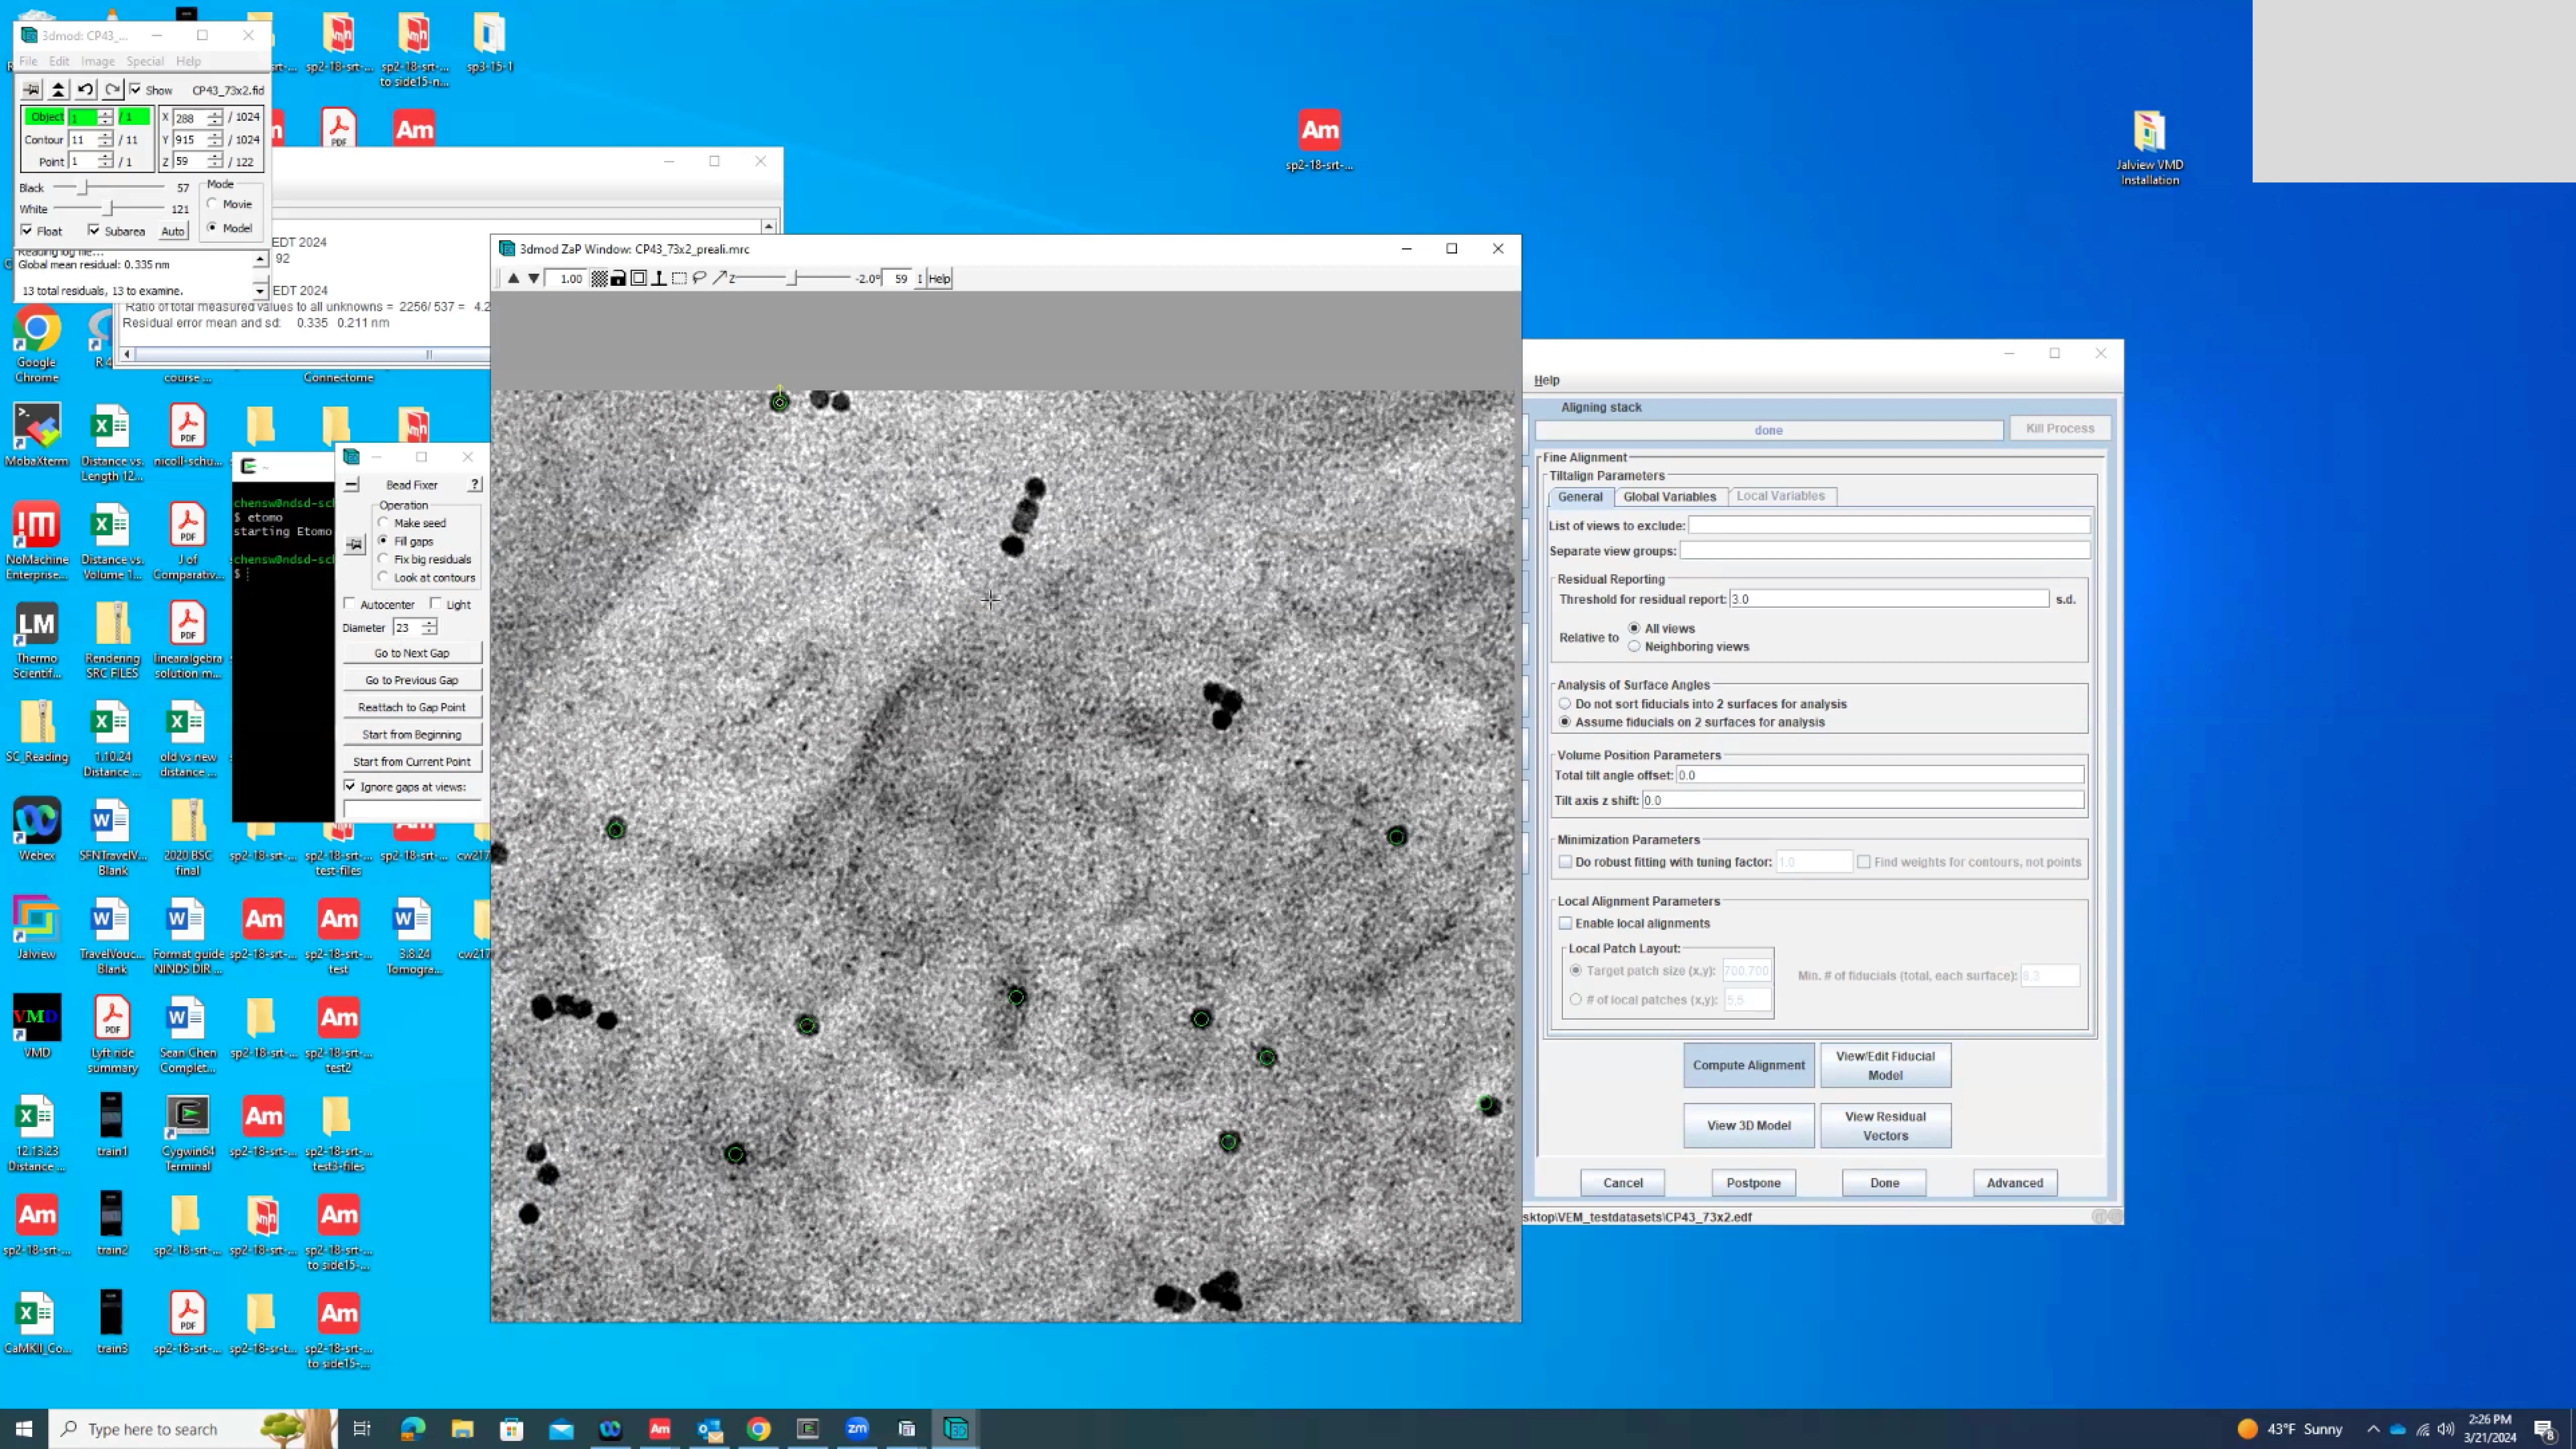
Problem
Under-featured image analysis programs force neuroscientists to constantly switch between working and manually documenting their work in Excel. This slows down productivity and leads to inconsistent and inaccurate documentation.
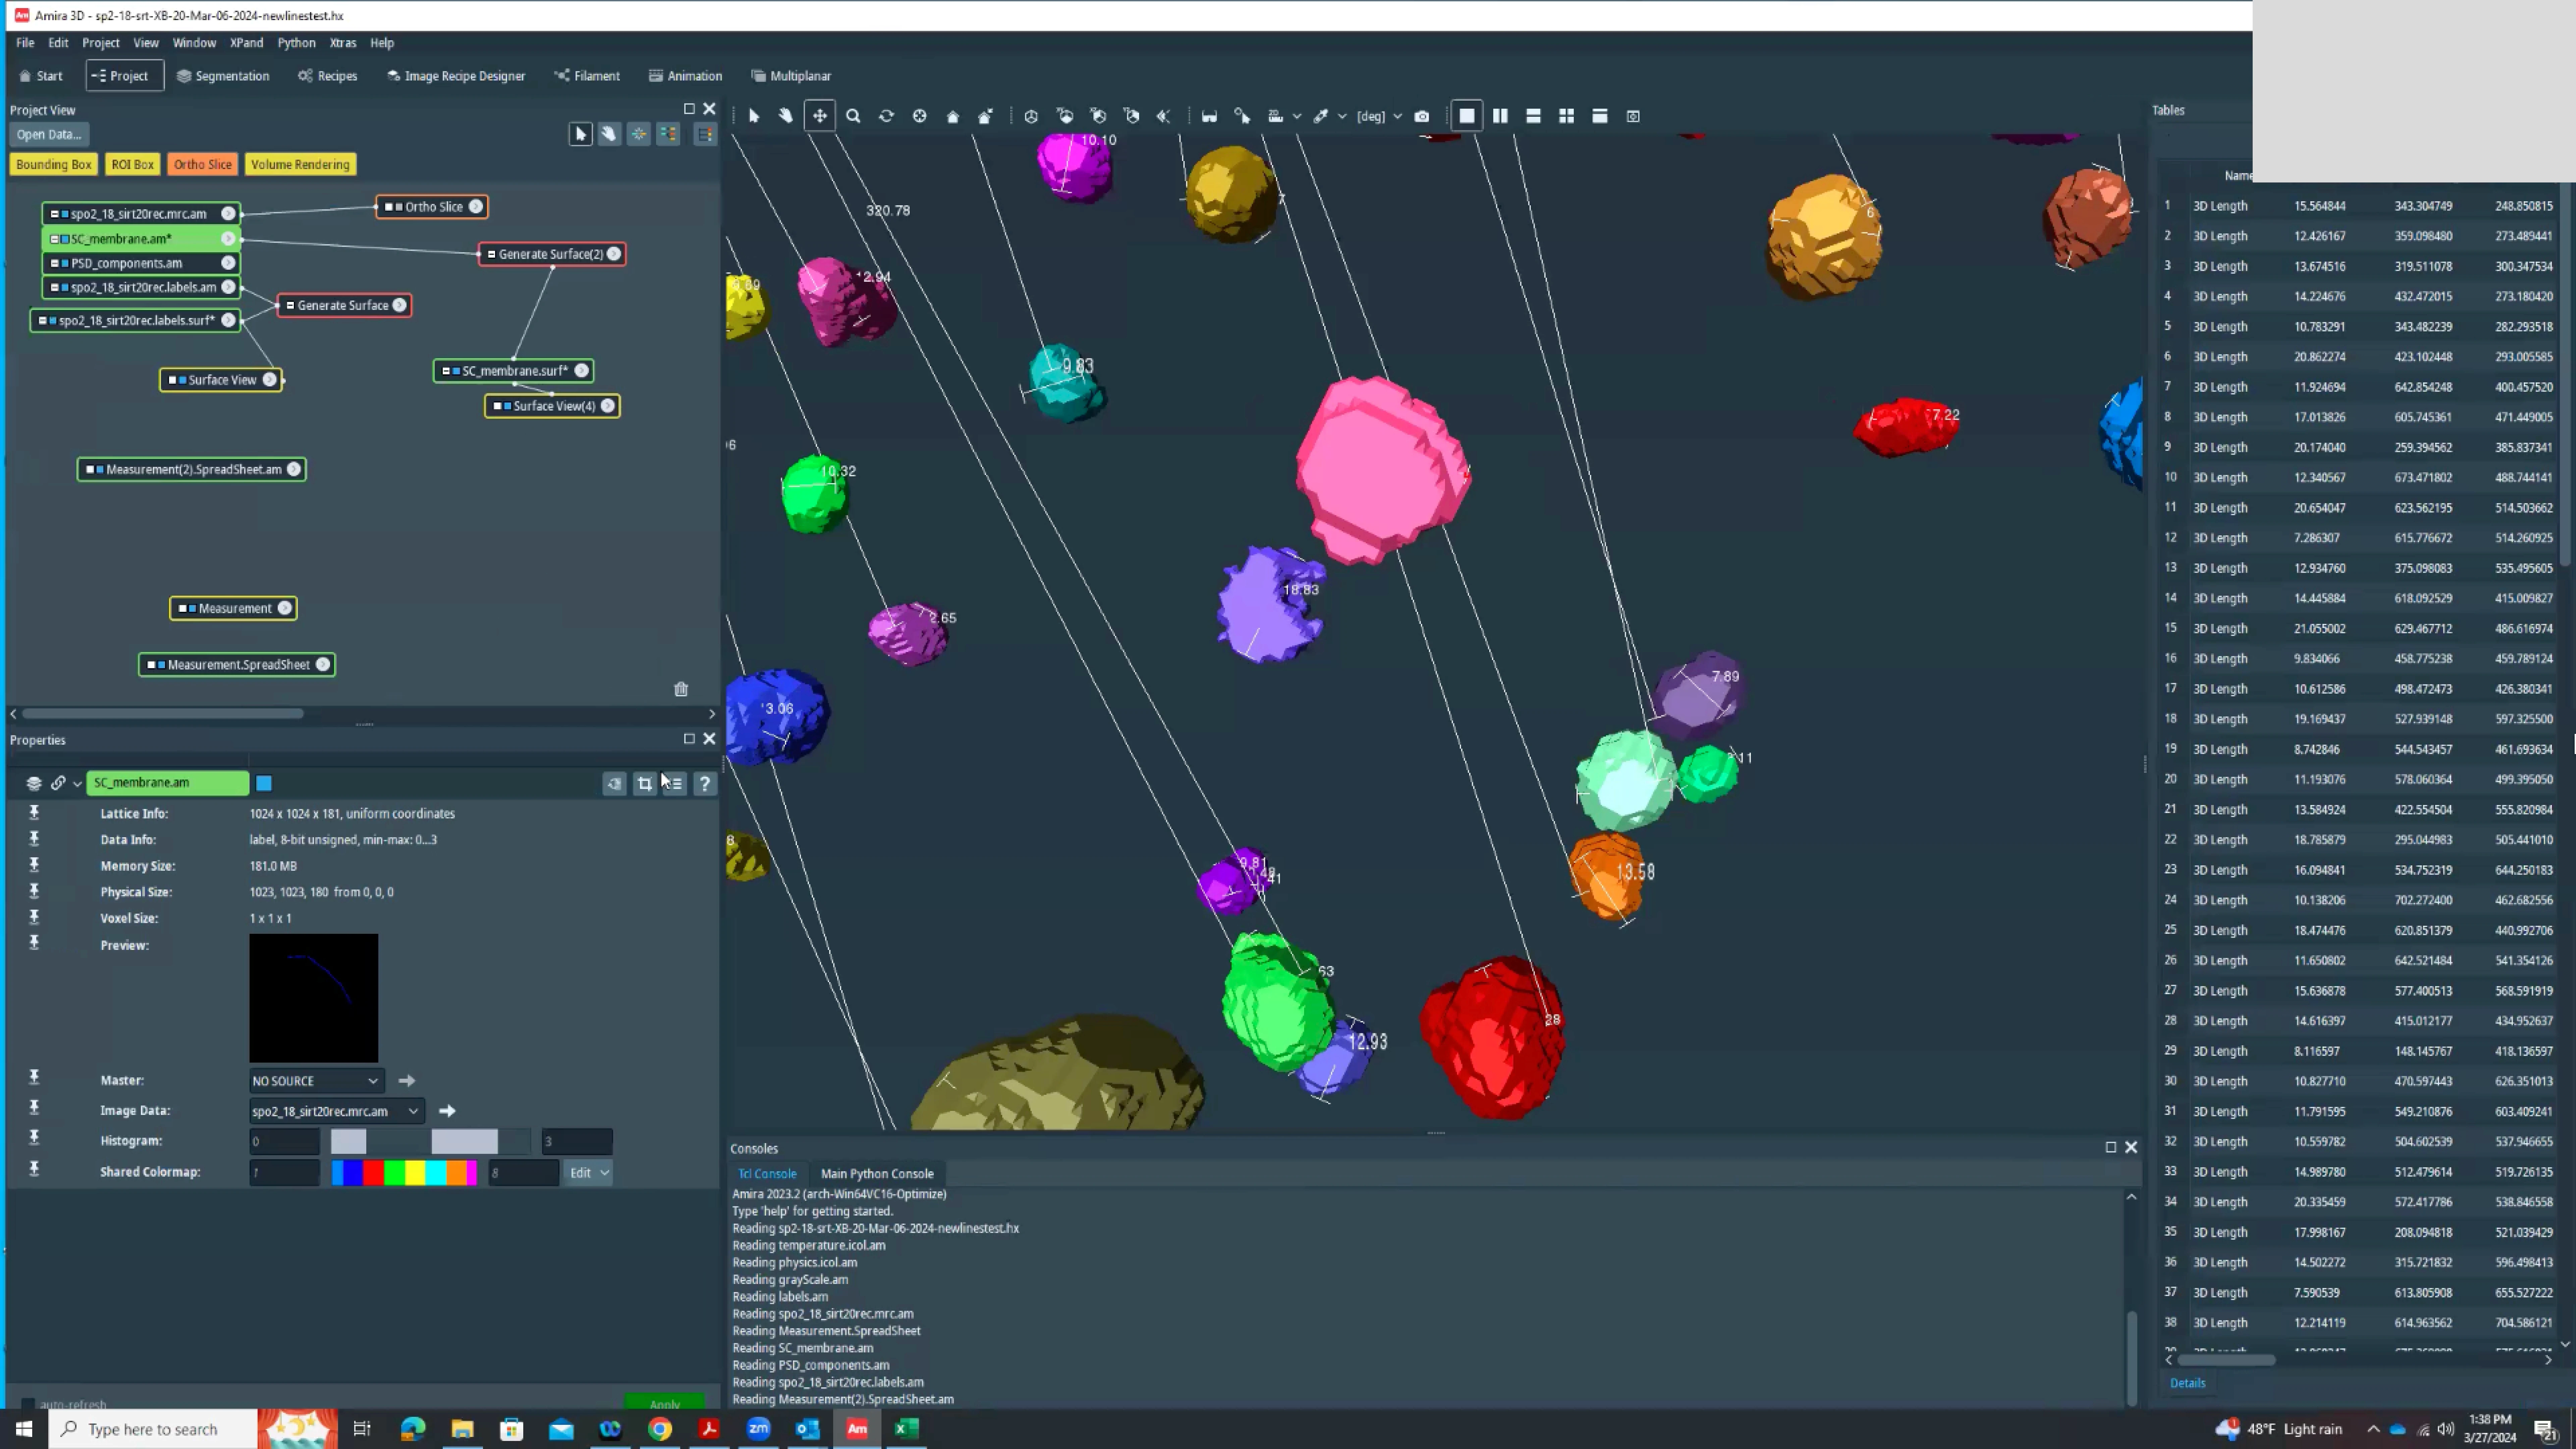
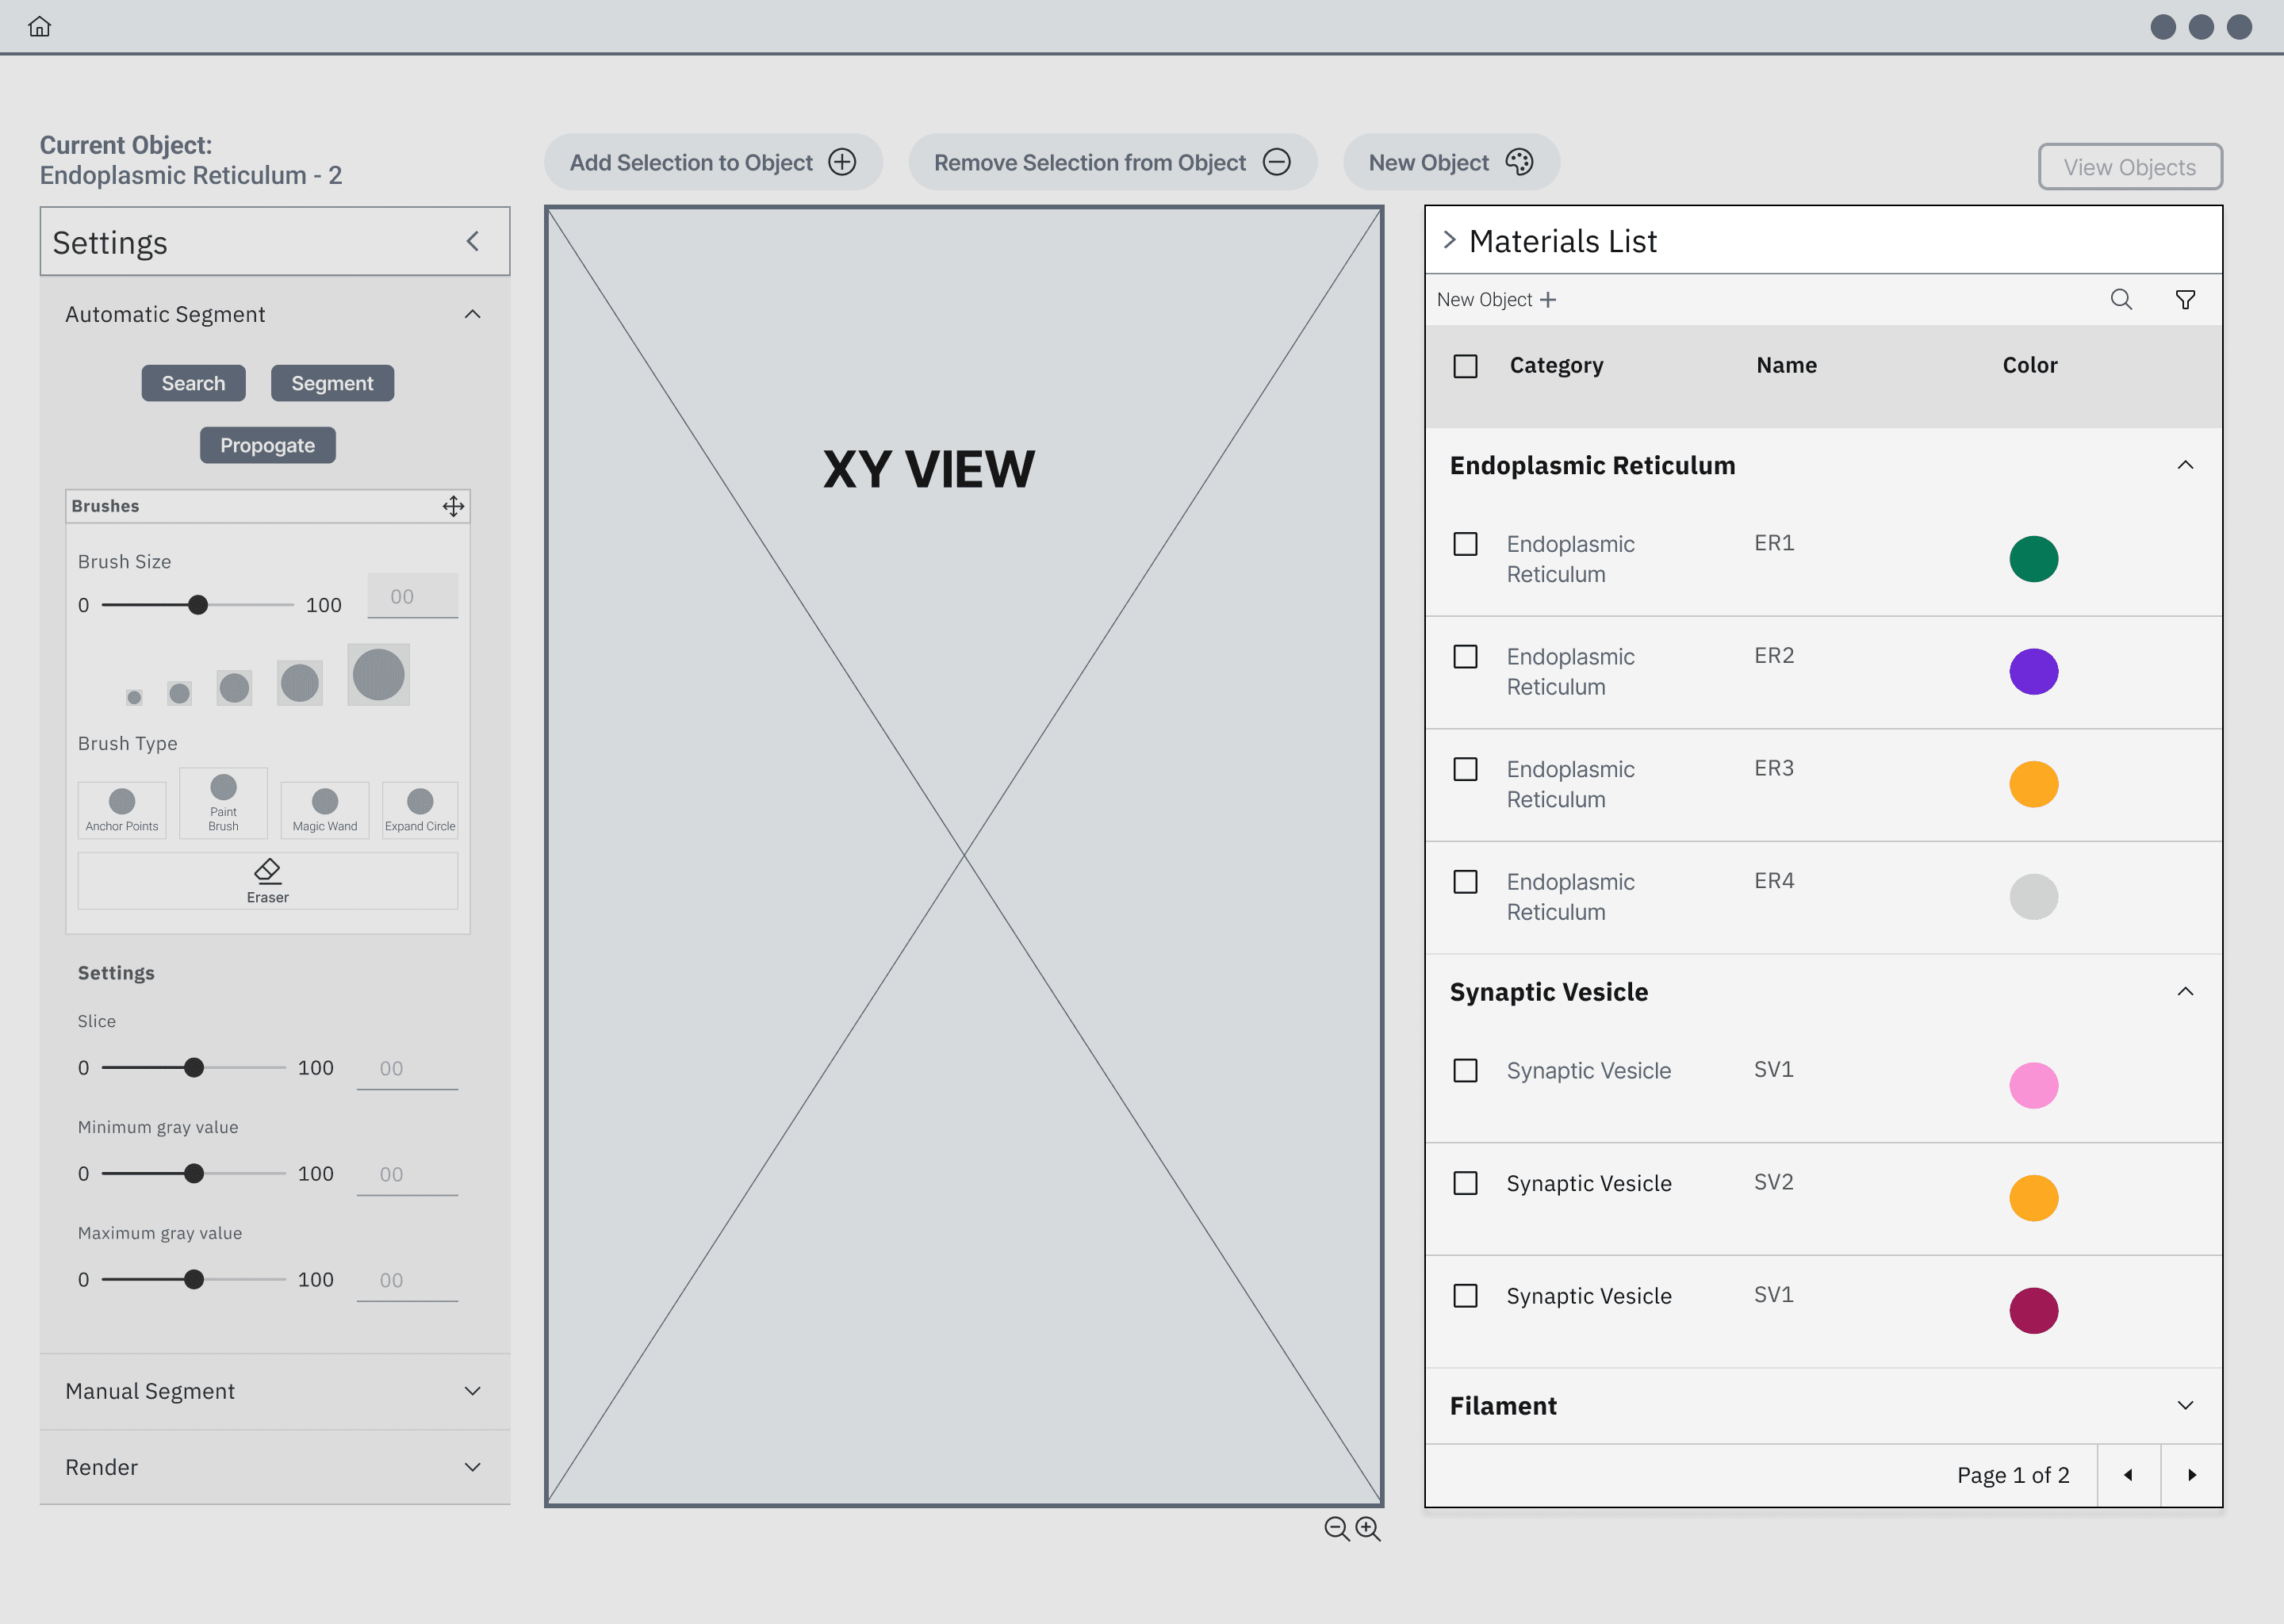
Before—poor visual hierarchy, reliance on external software for functionality, outdated visuals
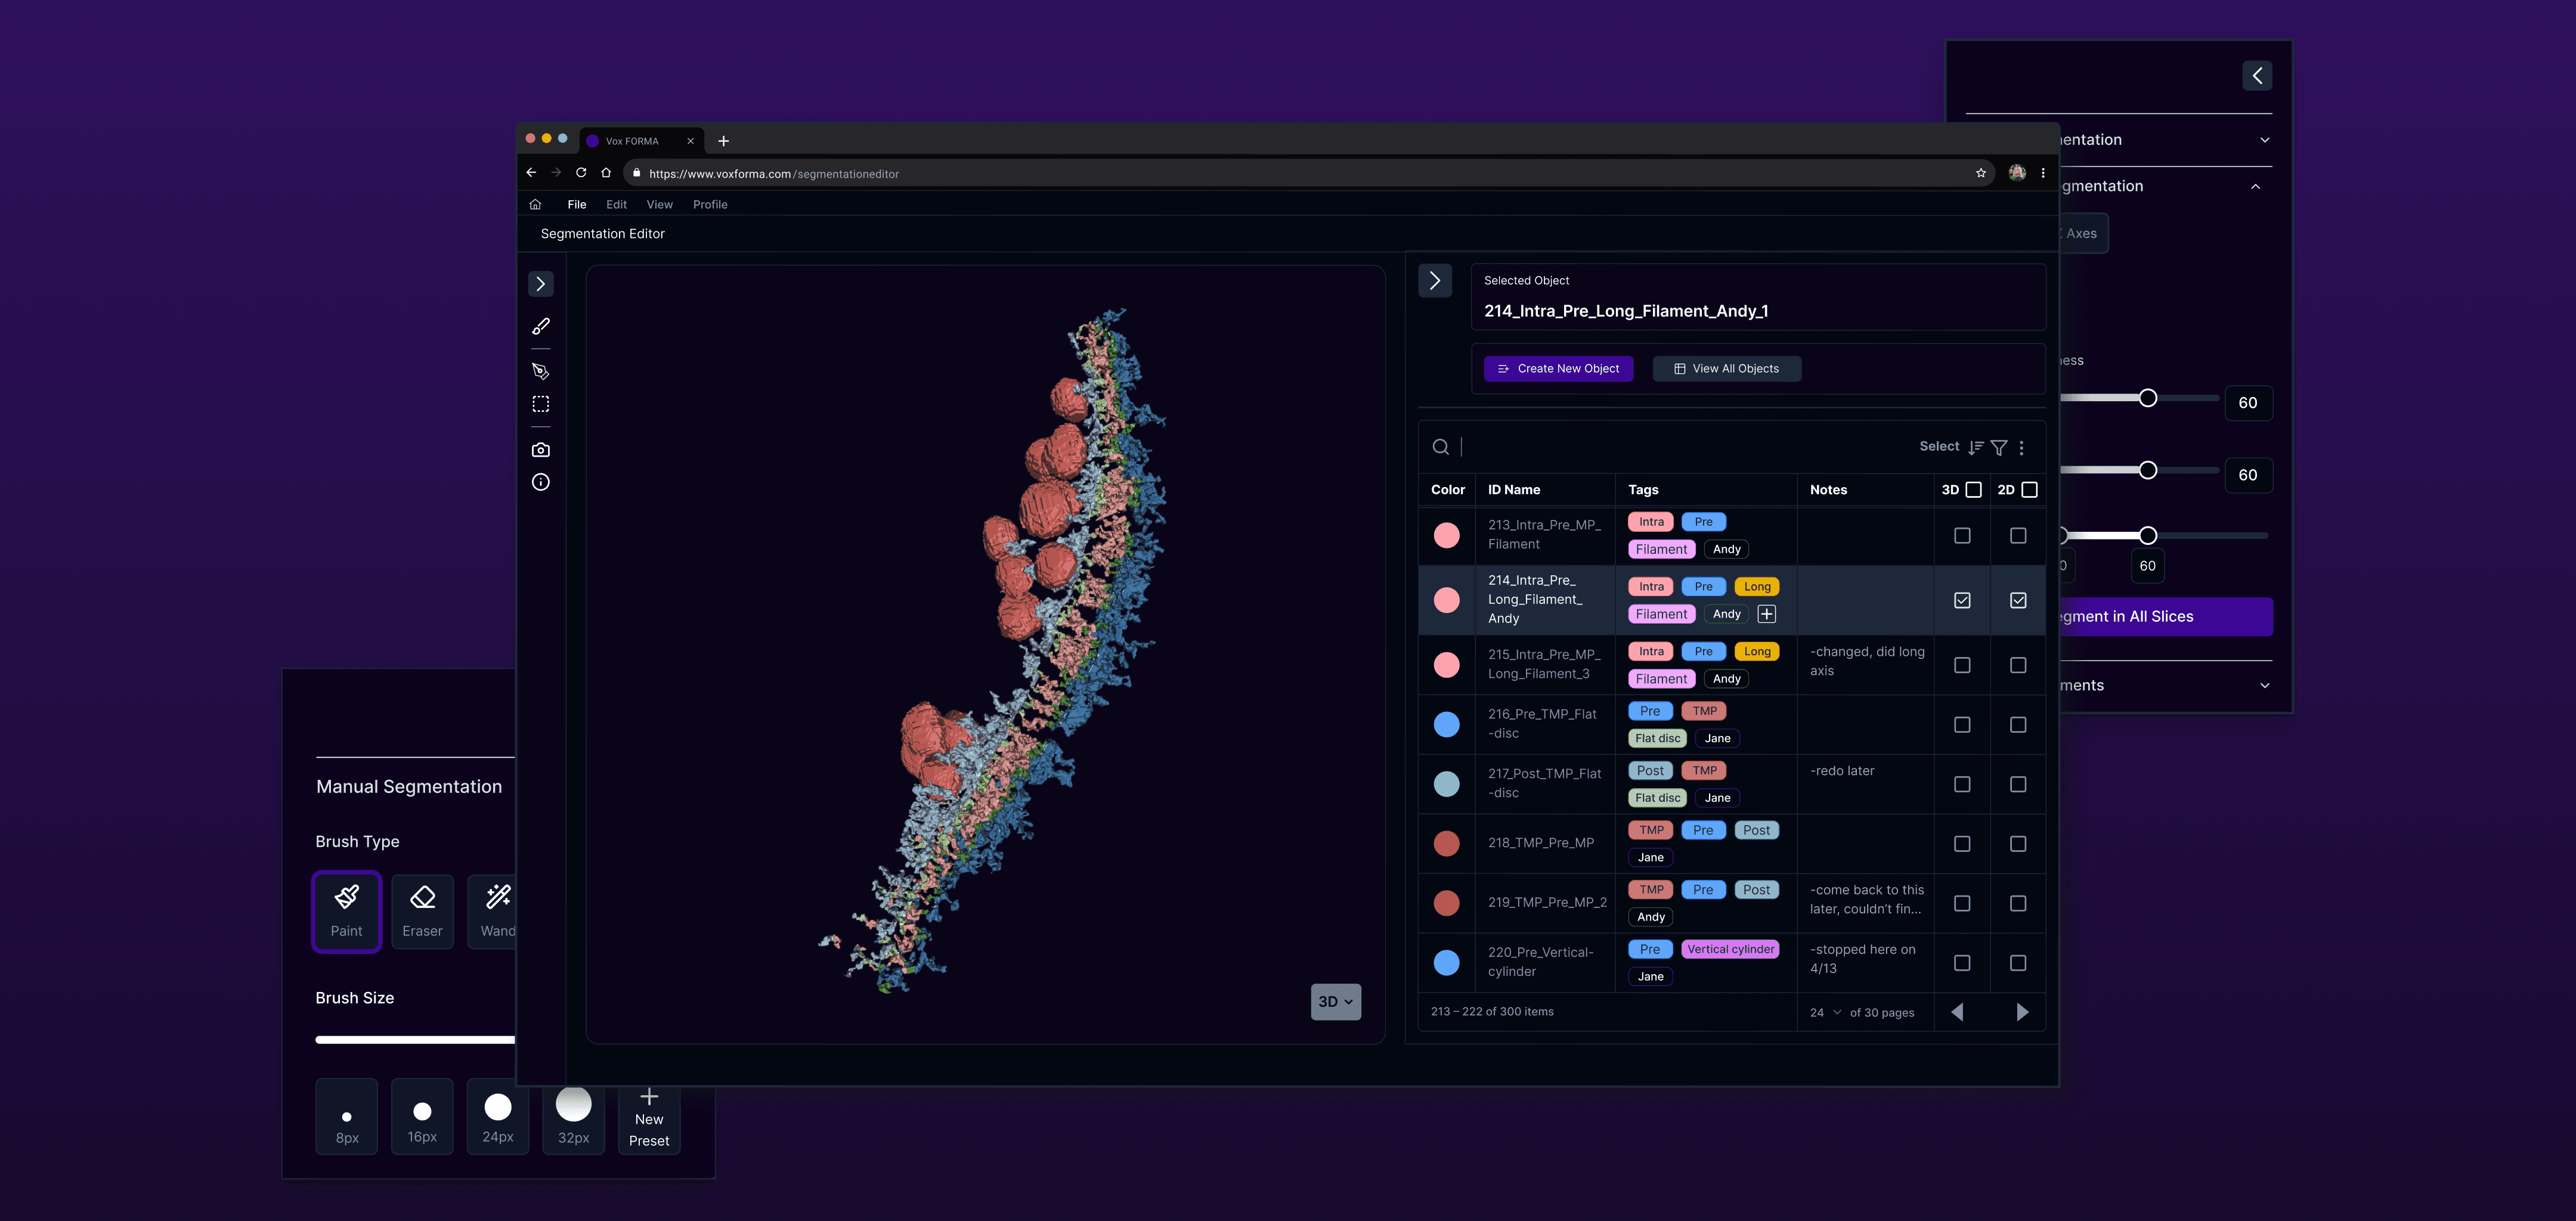
Solution
I redesigned the "Materials List" to be a data table, adding built-in tagging, filtering, and sorting features, which allow users to organize and interpret their data without leaving the app—reducing context switching and streamlining the image analysis process.
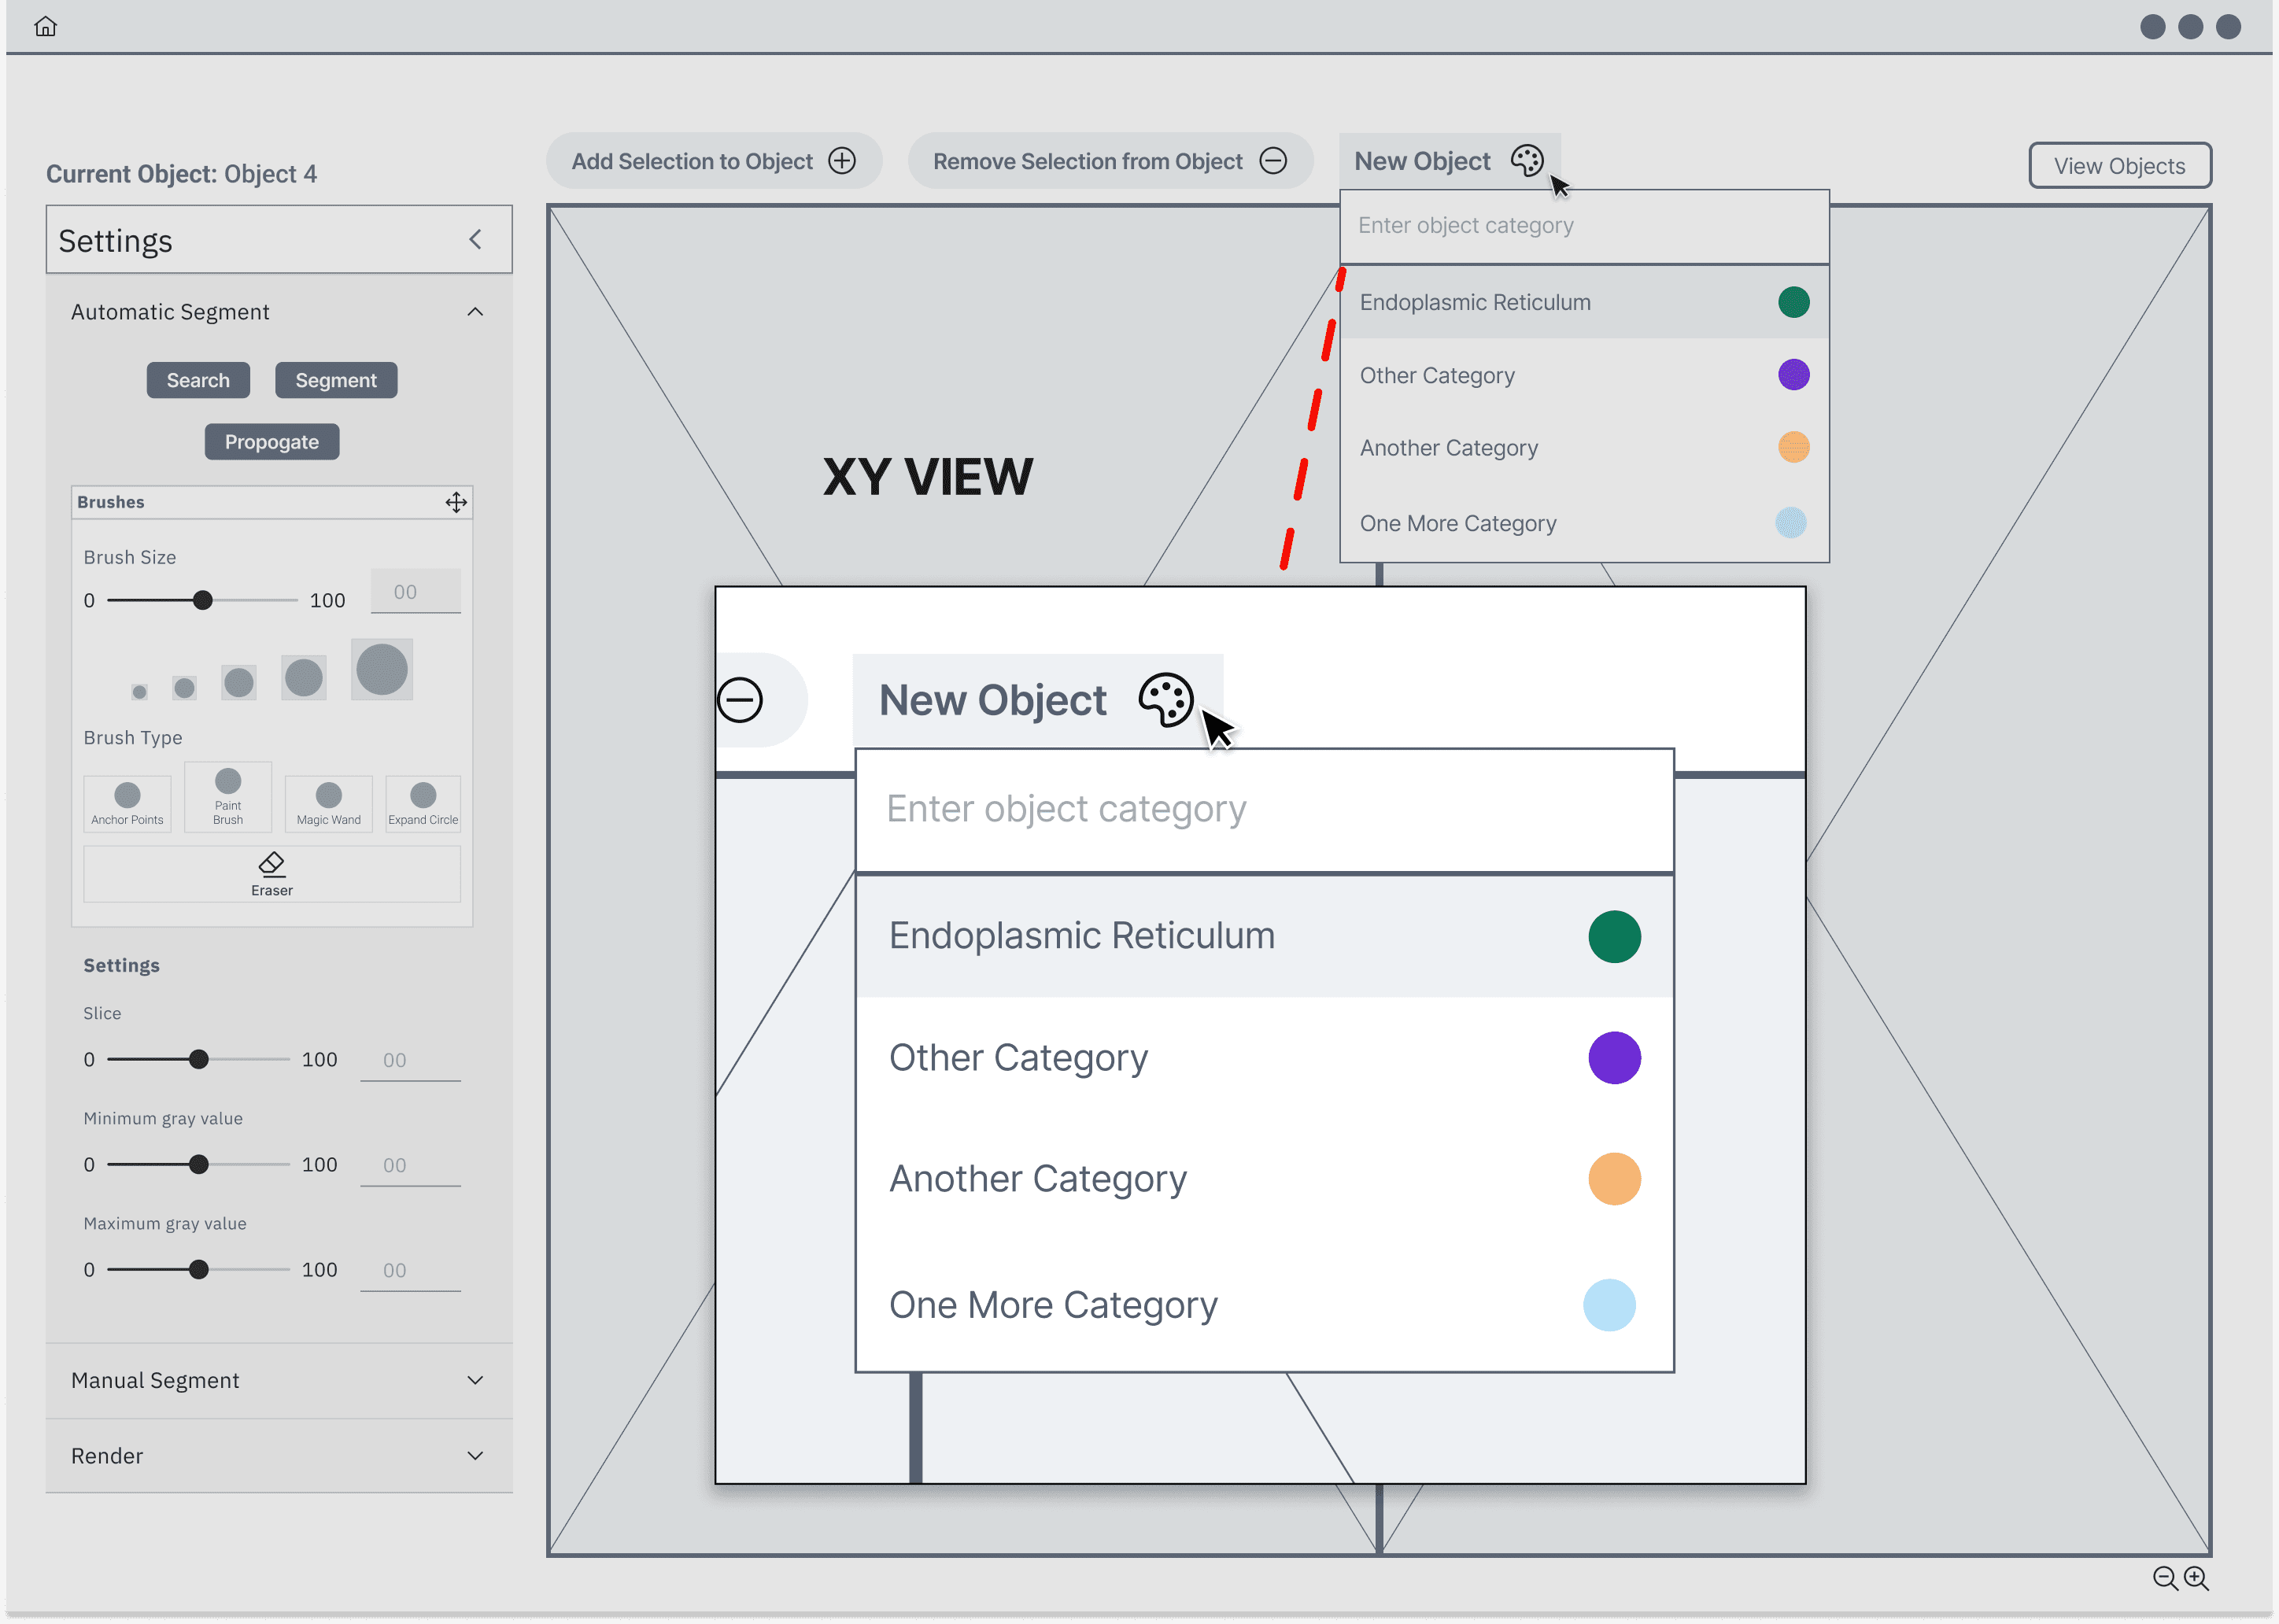
After—speed and accuracy improved with tags and filtering tools, modernized visual design
Final outcomes & projected business impact
Approximately 90% efficiency boost
I prototyped new workflows that reduced time on task by 50-90%. Coupled with the software’s advanced algorithm, project time could be reduced from five years to as little as one month.
$80,000 per year saved in labor costs
Improved ease of adoption enables interns at any research lab to quickly learn and contribute, making it possible to complete more work with less expensive employees.
$12,000 per year saved in software licensing
Developing VOX Forma in-house and making it an open source web app would eliminate the $12,000 annual licensing fee for competing software.
My process as the sole UX designer and researcher
Project background—Why was this product made?
Neuroscientists use segmentation software to digitally dissect 3D microscopic images, but existing tools prioritize raw functionality over user needs. VOX Forma is a web app created by and for the NIH neurobiology lab to replace expensive, confusing segmentation software with a faster, user-centered solution to boost research throughput and secure funding.
Learn more about my design process below ⬇️
Research methods—Going deep with a niche user group
With limited access to the niche user group (electron microscopists), I prioritized depth over breadth—conducting virtual and in-person interviews with scientists at the NIH lab of varying experience levels. They demonstrated their workflows with existing software, enabling me to gather insights through competitive analysis and heuristic evaluations.
3 personas, 3 mindsets

Has been using software the same way for years
Does not try new features or workflows
Not concerned about maximizing efficiency

Intentionally pushes software to its limits
Eager to adopt new features
Learns ways to make workflow more efficient and easier
Student Intern

Has to learn software quickly to make most of temporary internship
Typically learns from the "Set in Their Ways" user
Not around for long enough for workflow to change
Takeaways from user personas
Power users are rare 🦄
It is not safe to assume that all scientists are skilled software users, regardless of age or years of experience.
Workflows are highly user dependent 🔧
Workflows can look completely different between two users doing the same task
Difficult for novice users to learn new skills 📚
Existing segmentation software does not guide "Set in their Ways" users or "Student Intern" users to learn helpful features that would make their workflows easier and faster
The underpowered "Materials List"
Both power users and interns shared a major frustration with Amira, the competing segmentation program: its unwieldy Materials List.

With hundreds of segmented objects in a single file and no way to organize or search them, finding specific objects becomes tedious, making analysis slow and inefficient.
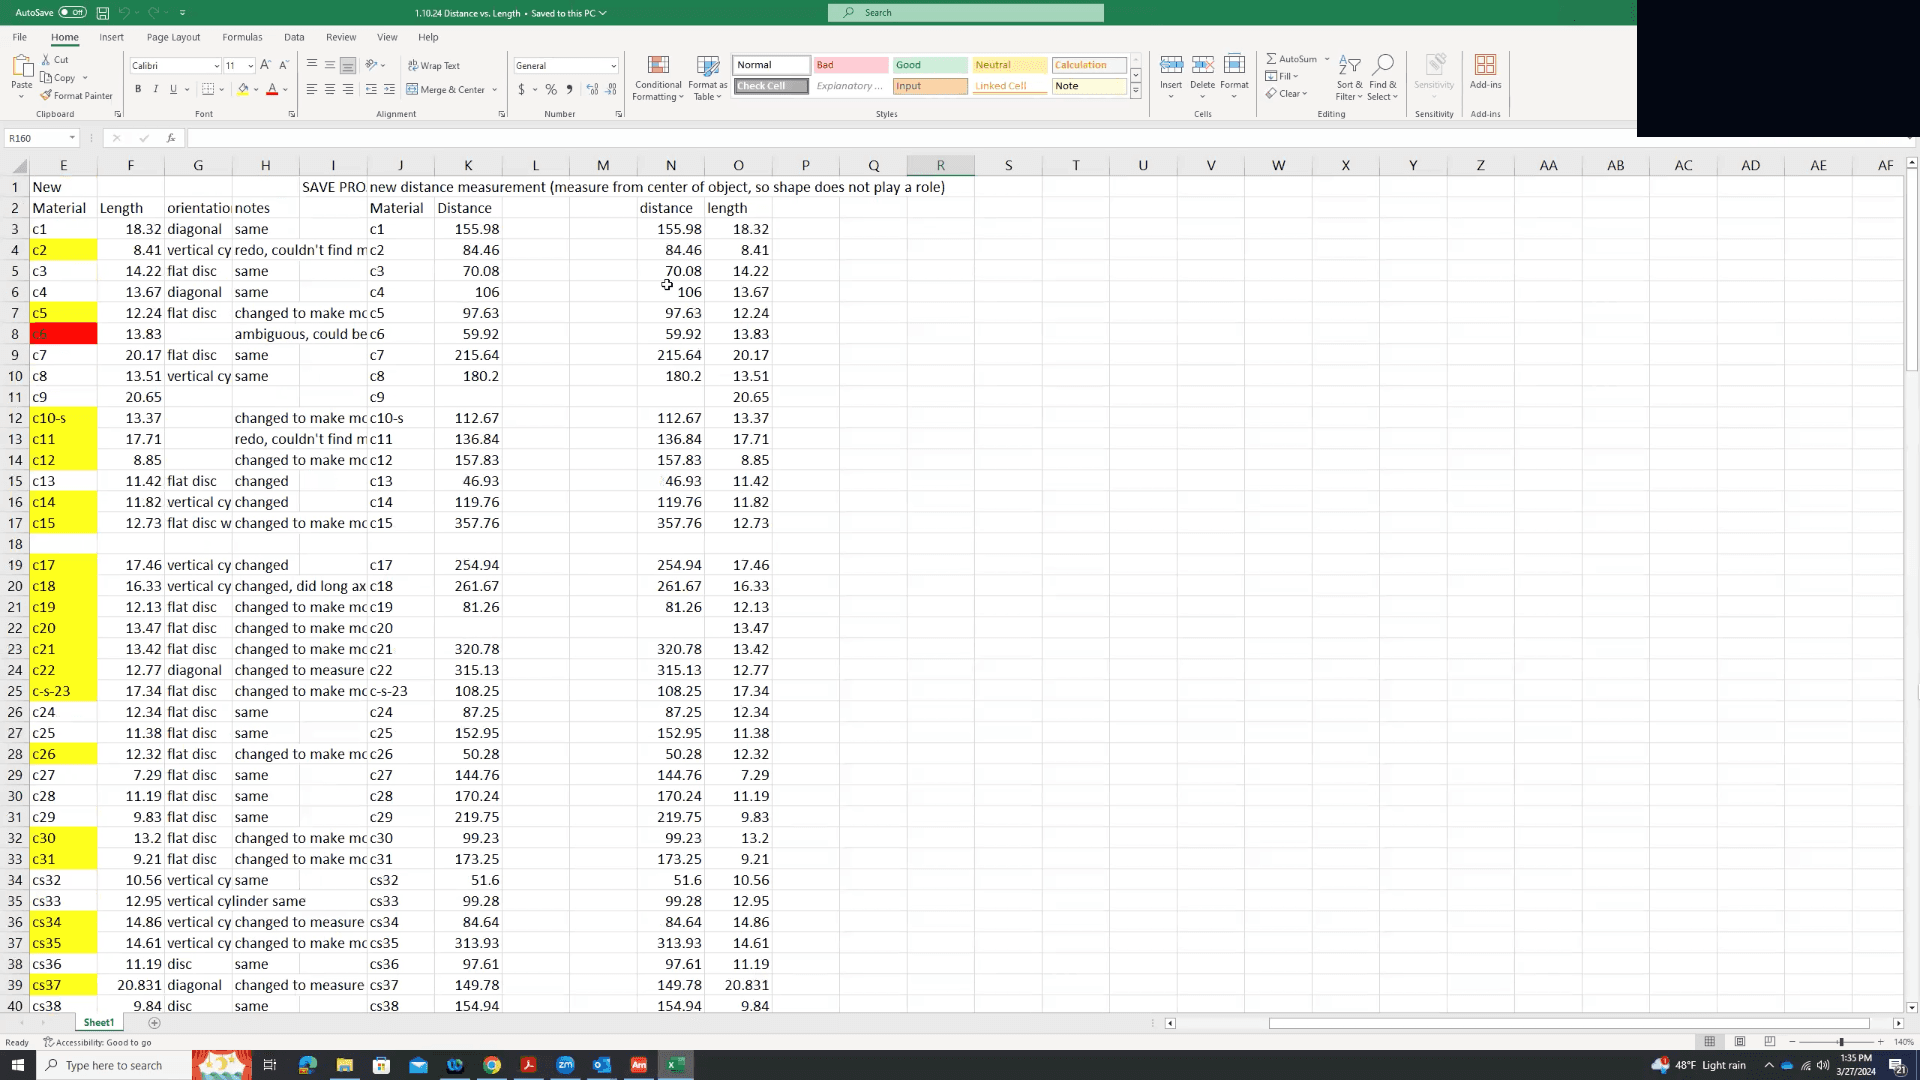
Forced context switching slows users down
Users are forced to create a spreadsheet in Excel to log and organize what they're working on, because taking notes about what they see, searching, sorting and filtering are not available in Amira.

—Intern user quote
Why this workaround is suboptimal
Users have to take notes frequently, once every 5-10 minutes, therefore slowing down their entire segmentation workflow
Creates margin for error when writing down critical measurements and other data that will be referred to later in the process for analysis
Key information for analysis is in a separate file (Excel) from the data itself (Amira), so when a research paper is being written months or even years later, the scientist(s) must cross reference both files
Why this is the right problem to solve
Scientists need to explore and interact with data freely and thoroughly in order to kickstart interpretation and critical analysis—the foundation of writing research papers.
Therefore, the right tools can significantly accelerate the publication of research papers, which secures more money for their labs.
Improving the "Materials List" by failing fast
During usability testing, I learned that users were segmenting hundreds of repeating object types. Therefore, I thought that users could organize their lists by placing each new object into a category—labeling every item to ultimately condense the list.
Early wireframe of materials list with all items organized by category
This incorrect assumption was before I spoke with more users, and realized that this workflow is incompatible with how the segmentation works in practice.
Why was this solution wrong?
Because each object typically belongs to multiple categories, an organizational method like “bins” would be an impractical solution.
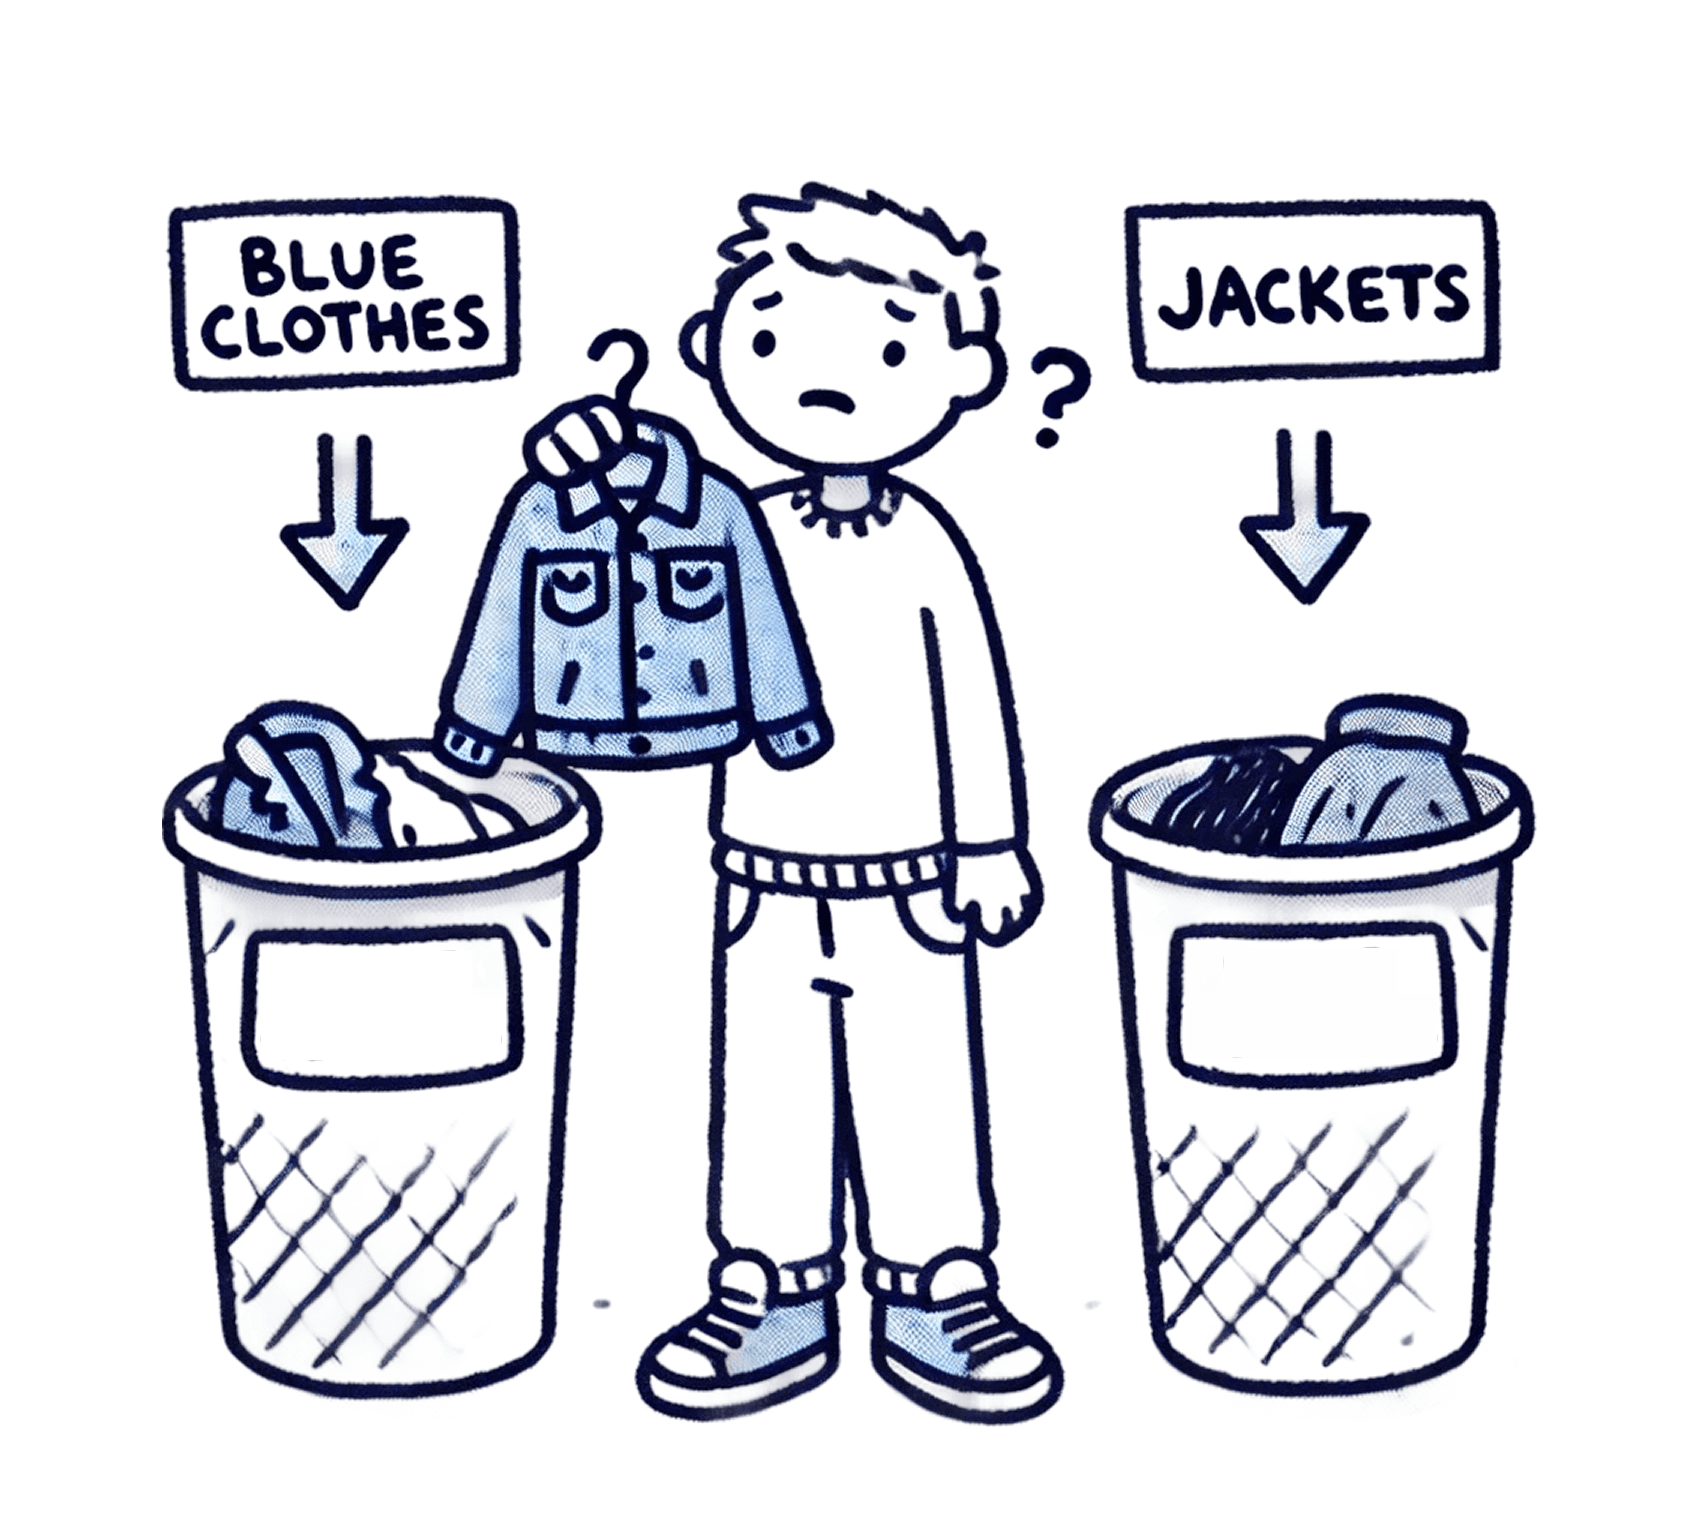
The jacket falls under both categories—but a rigid system forces users to pick just one.
In practice, users know descriptive aspects about the objects they’re segmenting, but often don’t know what exactly it is until much later on, if ever.
"While you're segmenting, you don't know what everything you're looking at is yet, but you can identify characteristics about each thing you see."
Tags offer users maximum flexibility and spontaneity, enabling them to quickly capture key attributes of an object while leaving room to refine or expand their notes as new insights emerge.
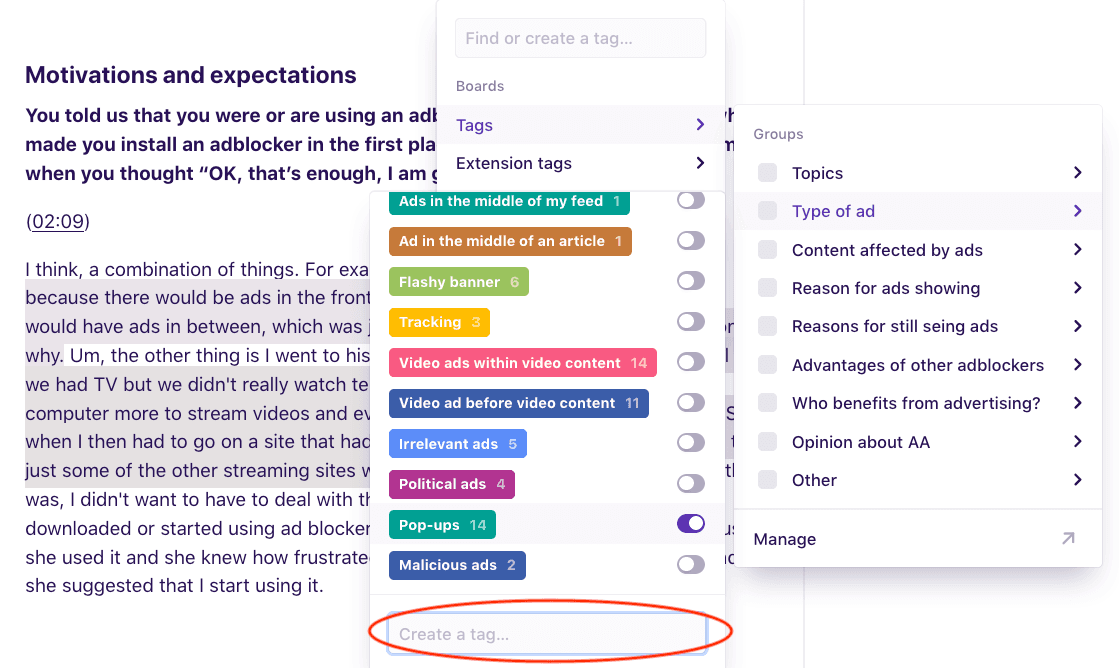
Competitive analysis of Dovetail, which uses tags for spontaneous labeling of sections of qualitative data for UX researchers
Refining ideas for engineering feasibility
However, engineers raised concerns about performance and database complexity.
We came to a compromise where users can easily download a CSV file of their table that can be opened in Excel. When exporting, they can add more columns. This eliminates the need for manual data entry because the critical data is baked in.
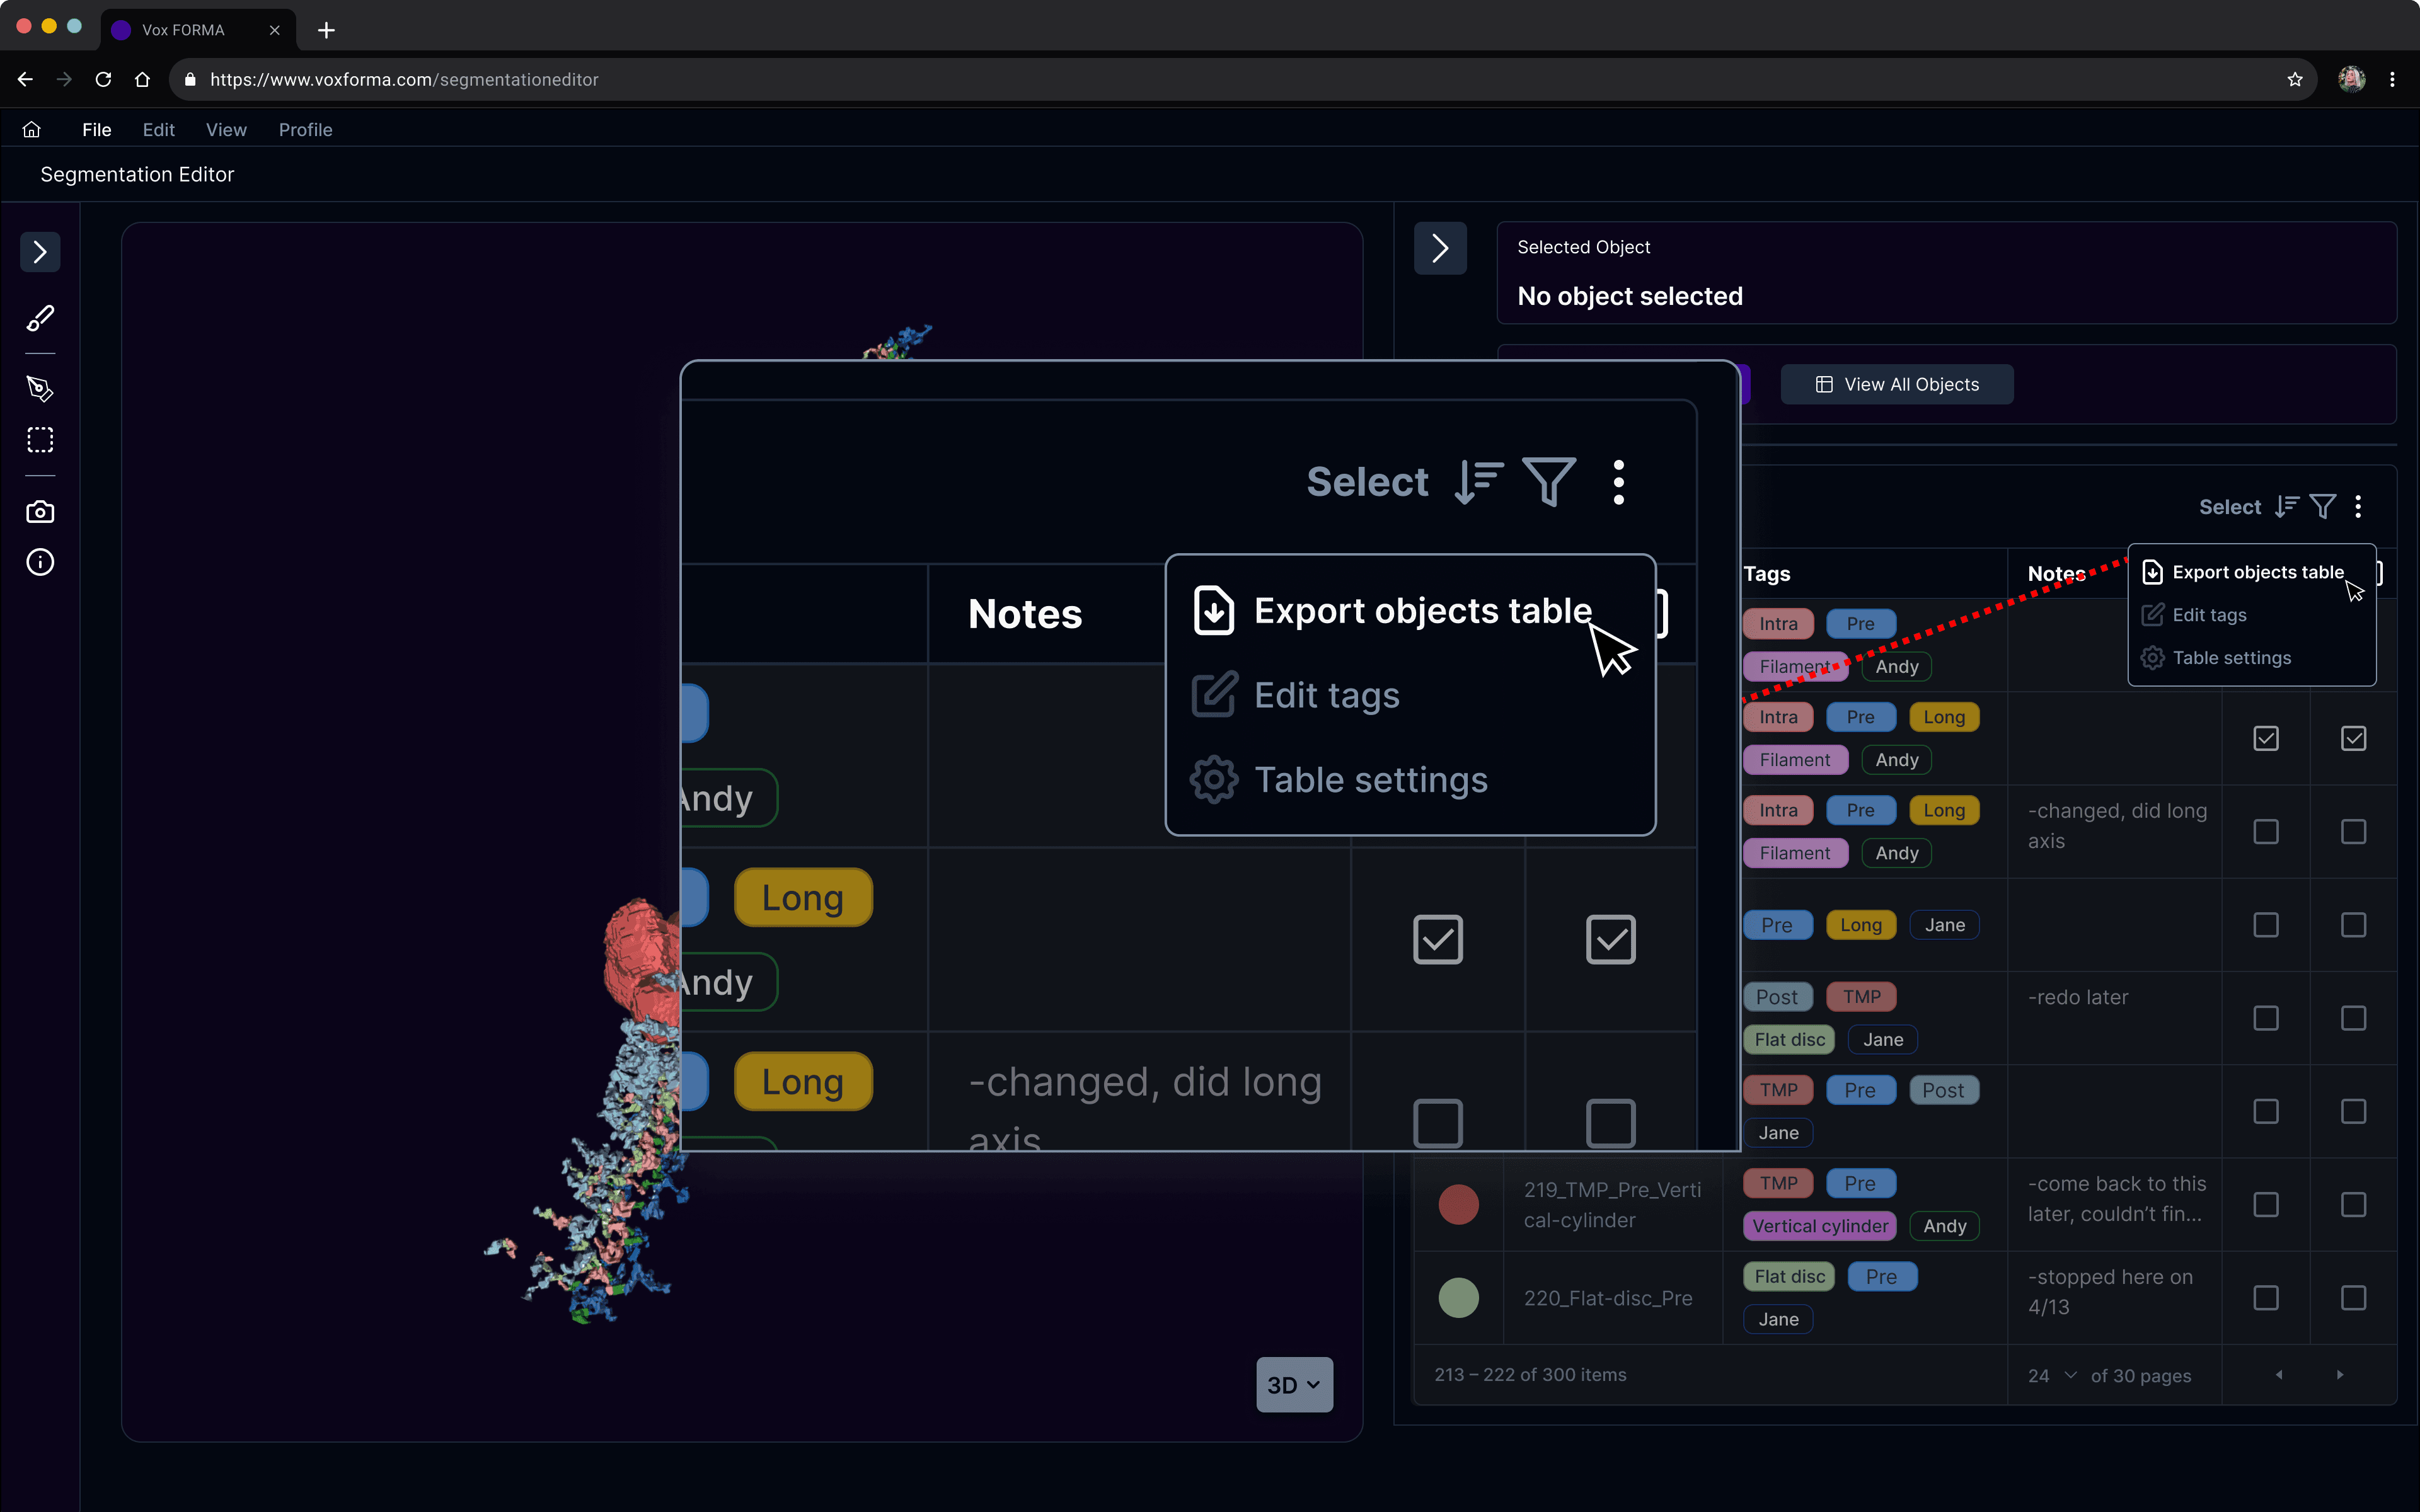
"Export objects table" button is easy to find on the table itself
In a perfect world, the table would be perfectly optimized for each user and also be capable of performing complex quantitative data analysis, but for engineering feasibility, we arrived at this alternative solution as a team.
I worked with a power user to ensure the “Add columns” list in the export settings covered all the fields they would've typically added manually in Excel. By pulling data directly from the program, this solution eliminates tedious data entry while ensuring accuracy and consistency.
Prototype of exporting objects table to spreadsheet
Prototype of naming object using tags
Quickly name objects with tags
Users can still freeform name each object, but the default naming system organizes names based on tag order. This allows for fast labeling with the flexibility to refine later.
Prototype of searching for specific object
Smarter sorting
Users can sort objects by size automatically, instead of manually entering sizes in an Excel spreadsheet and then sorting there.
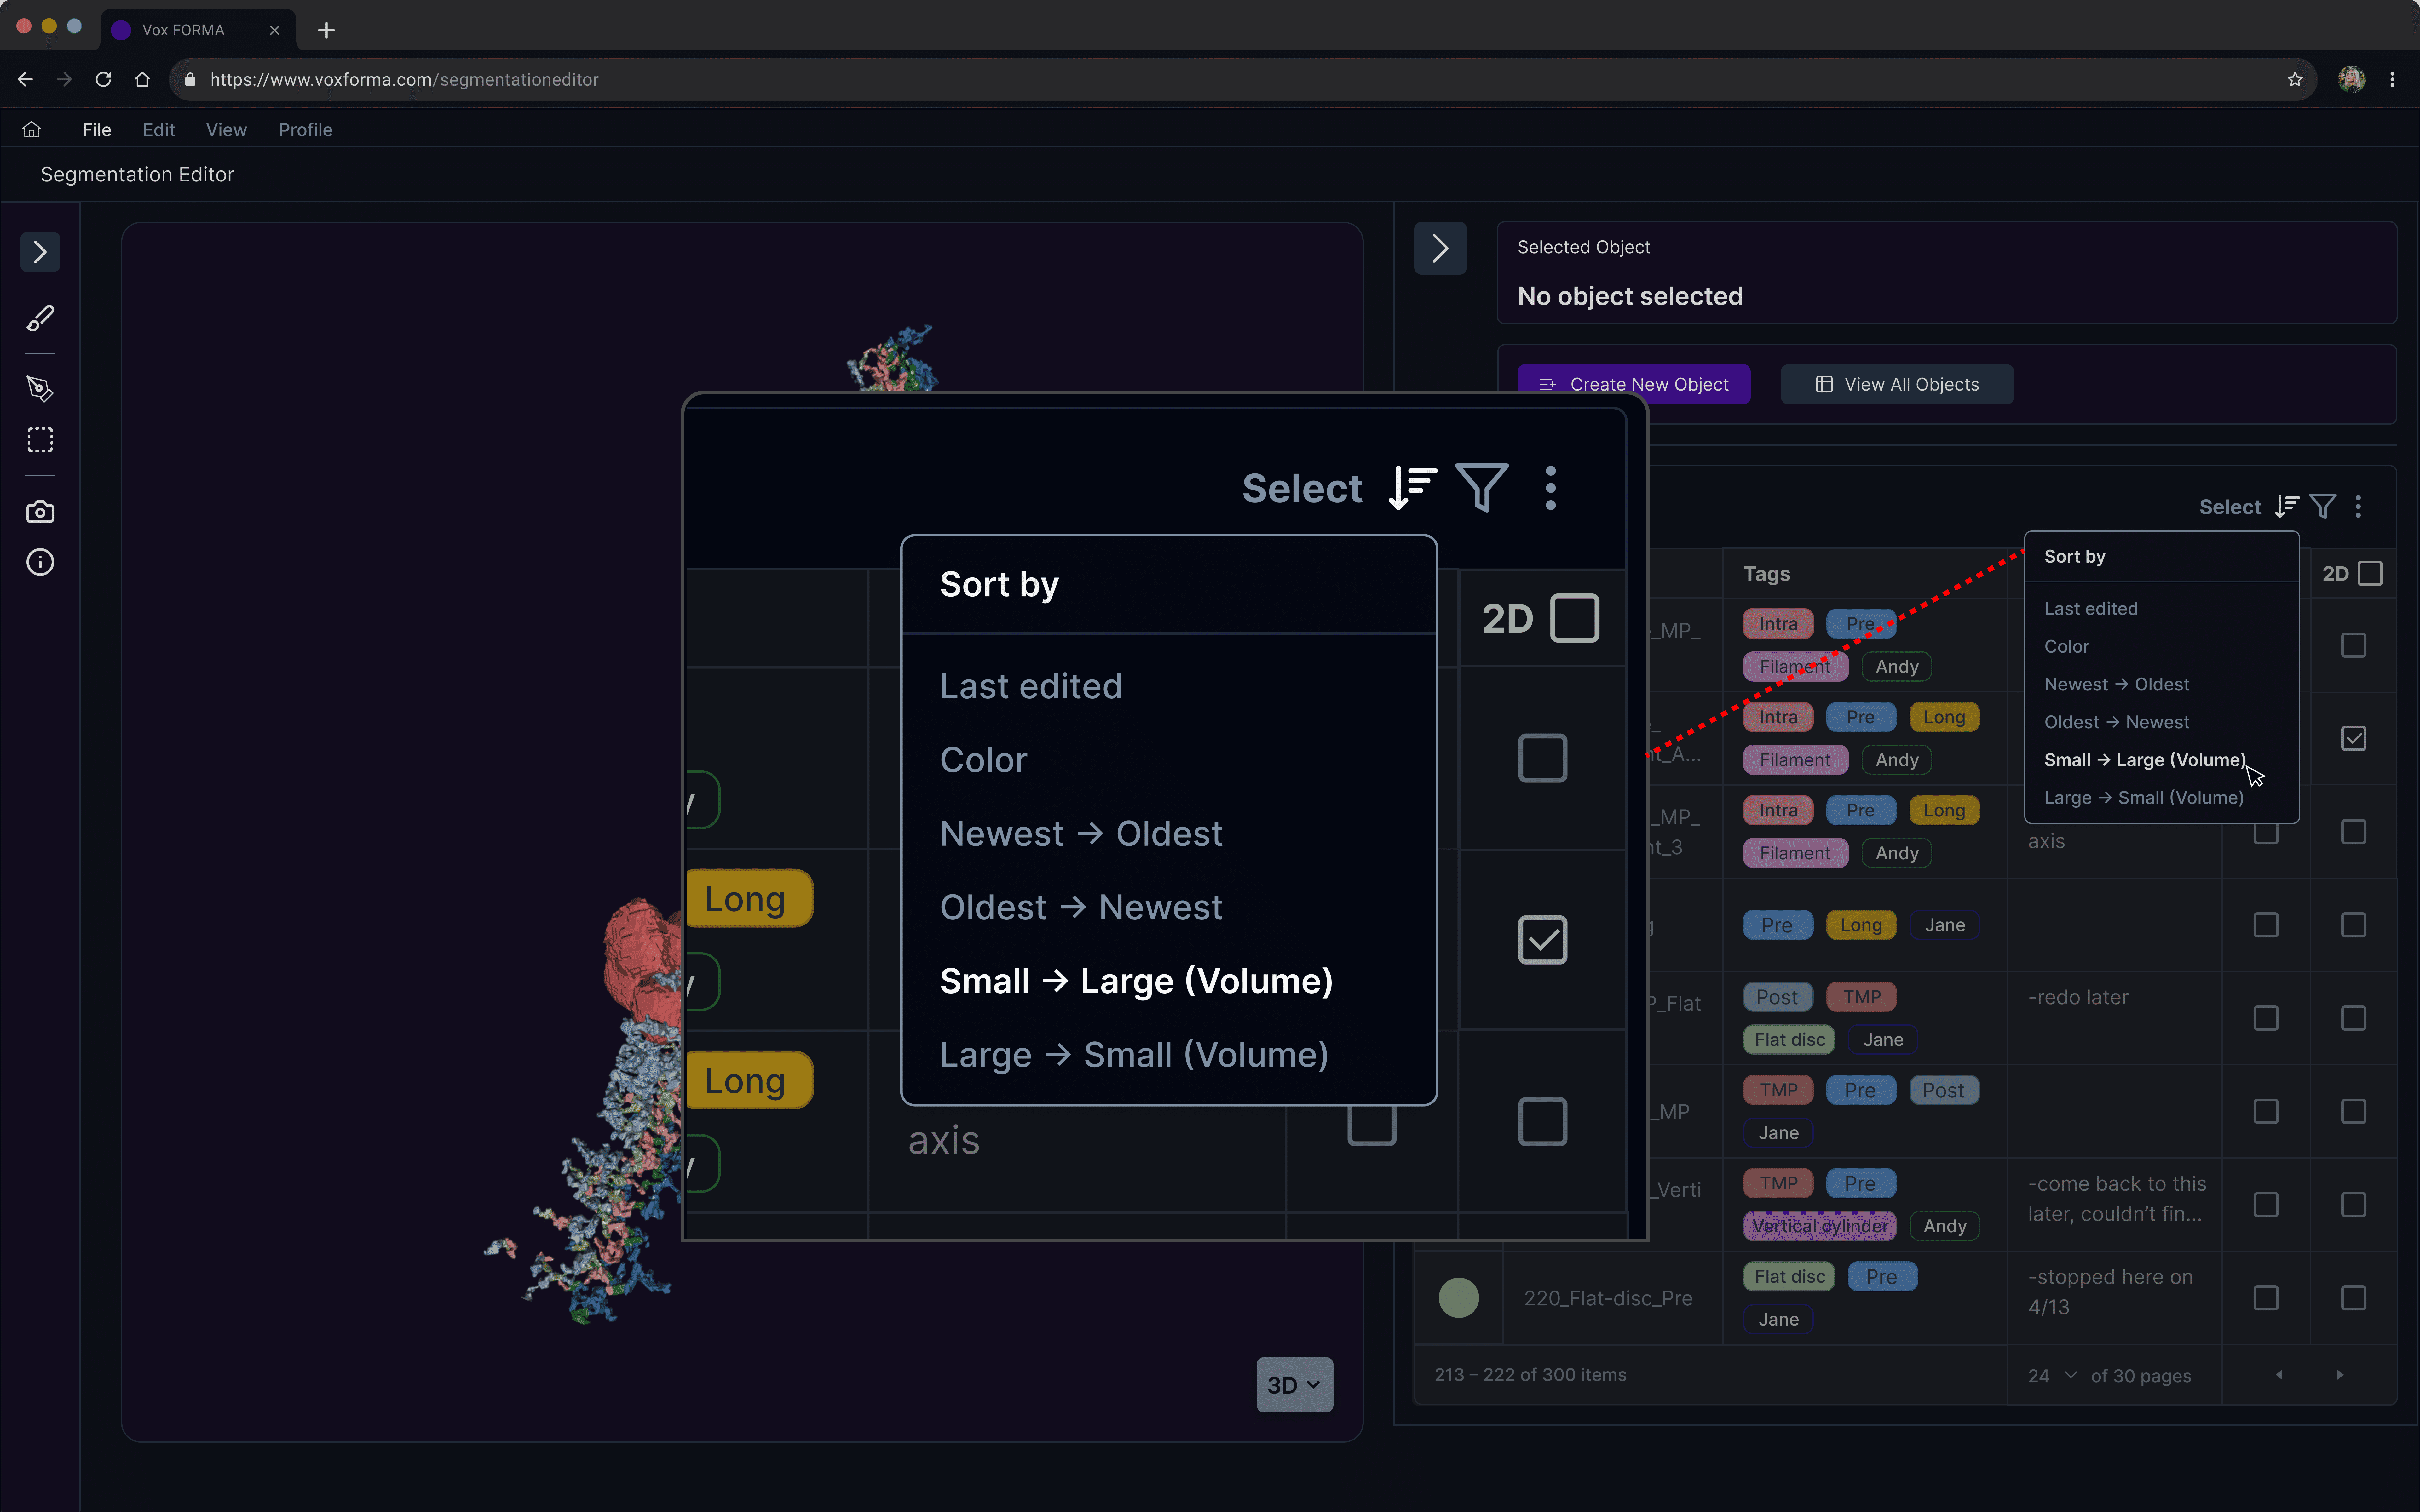
Sorting by volume size available in-app so that user doesn't need Excel
Filtering with tags unlocks more ways to view images
When just searching is insufficient, users can filter for objects that contain multiple tags.
Next steps
While VOX Forma didn’t reach full implementation due to restructuring, its design features may be implemented in a similar segmentation program in development abroad.
Other features that were designed, but out of scope for this case study, included machine learning algorithms for automated segmentation and confidence interval assessments, remote collaboration features, and plugins to cater to a greater variety of professions and users.
If the project will resume, we aim to conduct both moderated and unmoderated user testing to compare old and new workflows with a larger sample of scientists. Key metrics for evaluation would include time on task, task completion rates, and error rates.
If I could go back…
Ruthless prioritization
In future projects, I’ll work to ensure the MVP remains lean and testable, allowing for more feedback and iteration.
Proactive communication and expectation management
Early alignment with the product owner and engineers on timelines and priorities could have helped manage scope creep and kept the team focused on the MVP’s core features.
Adaptation and documentation
The project’s halt due to restructuring highlighted the need for resilience and contingency planning. I’ve learned to ensure key milestones and documentation are up-to-date to handle unexpected changes more effectively.